Data Room Analytics (2026): Most Visited Documents and Recent Visits

Data room analytics in Sendpaper answer two questions: which documents get the most engagement, and who visited the room and what they did. The analytics tab for each data room is built around two views: Most Visited Documents and Recent Visits. Both use the same room-level activity (room opens, document opens, downloads) and support a time range (e.g. last 7, 14, or 30 days, or a custom range) so you can see engagement for a specific period. This guide explains exactly what each view shows and how the metrics are computed.
What Data Room Analytics Gives You
- Local first - Analytics live inside each data room, not in a separate tool or dashboard. You open the room, go to the Analytics tab, and your numbers are right there. No switching apps or exporting to a spreadsheet; everything stays in one place so you can see who viewed what and which documents got traction without leaving the room.
- Room-level scope - Analytics are per data room. Open a room, go to the Analytics tab, and you see engagement for that room only. If you use groups, you can also see analytics filtered by group (same two views, scoped to that group’s viewers).
- Two main views - Most Visited Documents lists every document in the room with views, unique visitors, downloads, average time spent, and last viewed. Recent Visits lists each visit session with viewer, how many documents they opened, downloads, and first/last visit time.
- Time range - Choose last 7 days, 14 days, 30 days, or a custom date range. All counts and lists respect that range. Default is 7 days.
- Same events everywhere - Both views use the same underlying activity: when a viewer opens the room, when they open a document, and when they download. So “views” and “visitors” are consistent between the two tabs.
Below we go through each view in detail and what you see in the UI.
Data rooms and analytics by plan
Data rooms and data room analytics are available on Advance and above (Dataroom Pro, Dataroom Advance, Enterprise). The table below is a guide; see Pricing for the latest.
| Plan | Data rooms | Data room analytics |
|---|---|---|
| Free | 0 | No |
| Personal Pro | 0 | No |
| Advance | Unlimited | Yes |
| Dataroom Pro | Unlimited | Yes |
| Dataroom Advance | Unlimited | Yes |
| Enterprise | Unlimited | Yes |
Create a data room on Advance or a Dataroom plan to use Most Visited Documents and Recent Visits.
Most Visited Documents
Most Visited Documents answers: which documents in this room were opened the most, by how many people, how often they were downloaded, and how long viewers spent on them.
What You See in the Table
Each row is one document in the data room. The columns are:
| Column | What it means |
|---|---|
| Document | Document name and type icon. You can click through to the document. Filter by name to find a specific file. |
| Views | Total number of times this document was opened in the selected time range. Each open counts as one view. |
| Visitors | Number of unique viewers who opened this document in the range. One person opening it five times = 1 visitor, 5 views. |
| Downloads | Number of times this document was downloaded in the range. Includes single-file, folder, and bulk downloads; each time this document is included in a download, it is counted. |
| Avg Time | Average time spent viewing this document (across all views in the range). Shown in a human-readable format (e.g. 2m 30s). Only in-browser views are included; download-only access does not contribute to time. |
| Last Viewed | Date and time of the most recent document view in the range. “Never” if the document was only downloaded, not viewed. |
Documents are sorted by views (descending), then by downloads. So the “hottest” documents rise to the top. You can sort by any column in the UI. Rows can be expanded for more detail (e.g. deeper breakdown when we add it).
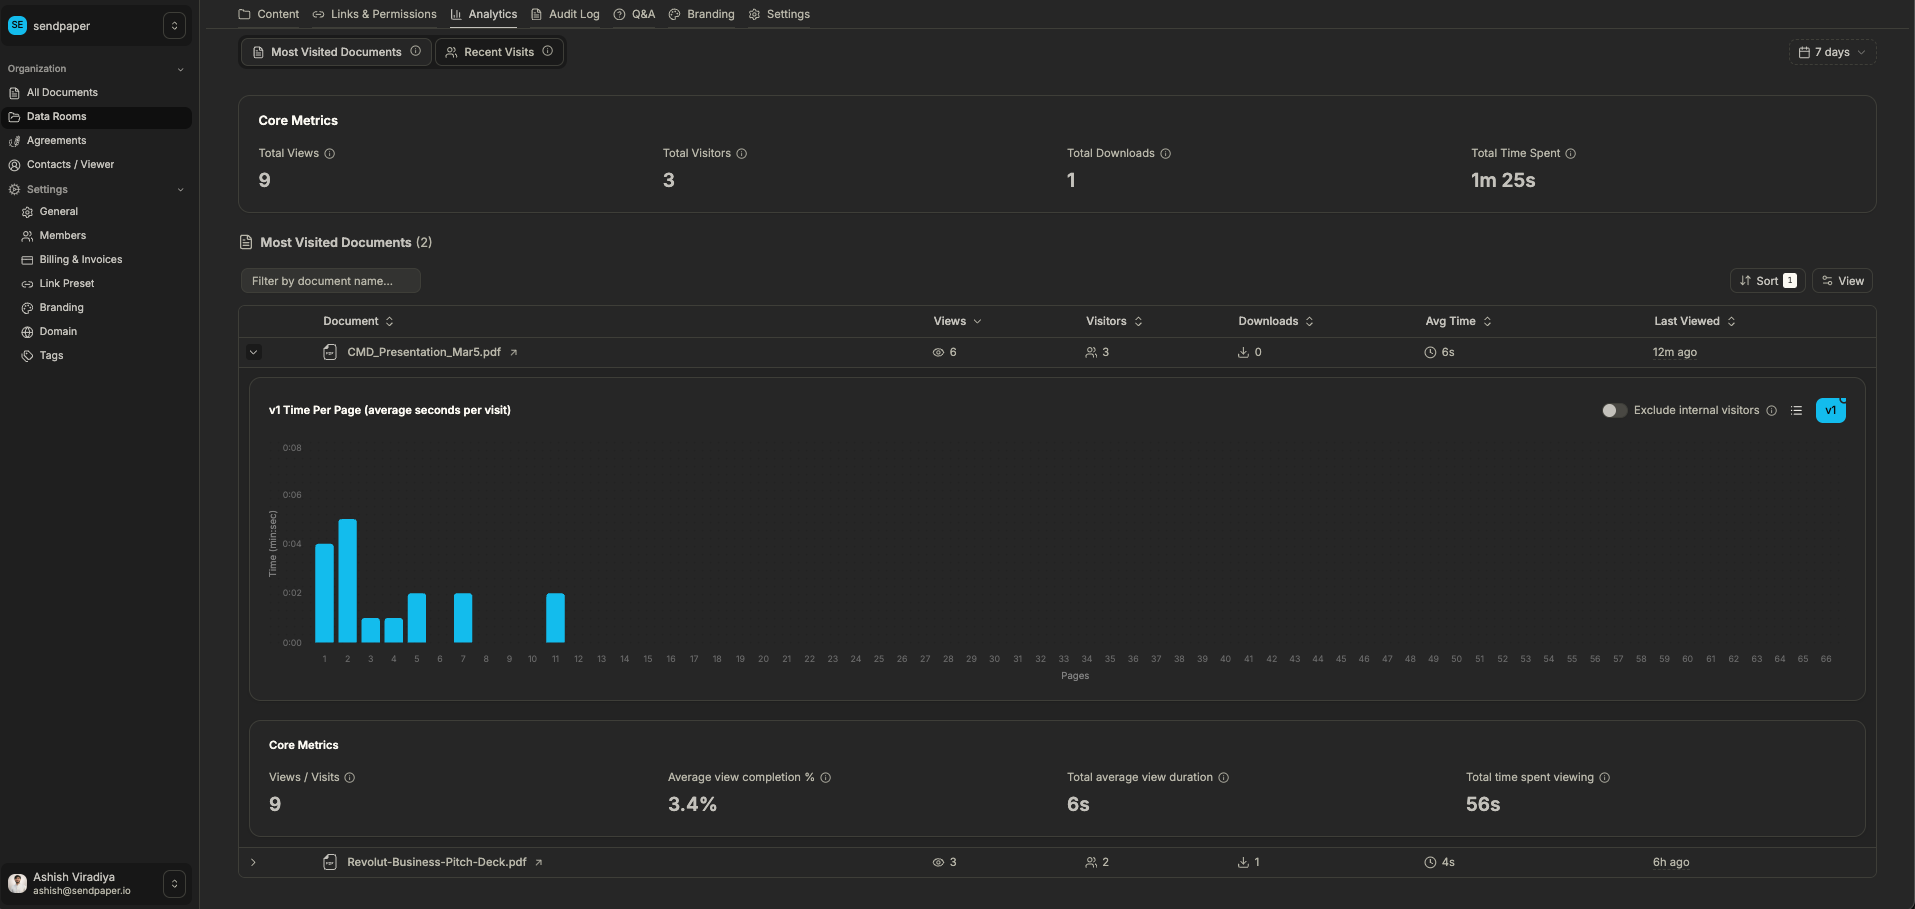
Most Visited Documents in a Sendpaper data room, with views, unique visitors, downloads, average time spent, and last viewed per document.
How the Numbers Are Computed
- Views - Every time someone opens this document in the room within the time range counts as one view.
- Visitors - Number of unique people who opened this document in the range. The same person opening it five times counts as one visitor and five views.
- Downloads - Every time this document was included in a download (single file, folder, or bulk) in the time range.
- Time spent - Total and average time viewers had this document open in the browser in the selected range.
- Last viewed - The most recent date and time this document was opened in the range.
If you filter by group, only views and downloads tied to that group’s viewers are included. So “Most Visited Documents” can be scoped to one audience (e.g. one investor group).
Recent Visits
Recent Visits answers: who opened the room, when, and what they did (how many documents they viewed and how many they downloaded).
What You See in the Table
Each row is one visit session: one viewer opening the data room (and possibly viewing documents and downloading) within the selected time range.
| Column | What it means |
|---|---|
| Viewer | Who visited: name and/or email. We show whether the email was verified and whether the viewer is internal (e.g. team member). You can filter by viewer. |
| Documents | Number of documents this viewer opened during this visit in the range. Each distinct document opened counts once per visit. |
| Downloads | Number of download actions by this viewer in the range (single, folder, or bulk). |
| First Visited | Date and time when this viewer first opened the data room in the selected range. |
| Last Visited | Date and time of their most recent room open in the range. |
The table is sorted by Last Visited (newest first) by default. You can sort by any column. Above the table you typically see summary cards: Total Visits, Unique Viewers, Documents Visited (sum of document opens across visits), and Total Downloads for the range.
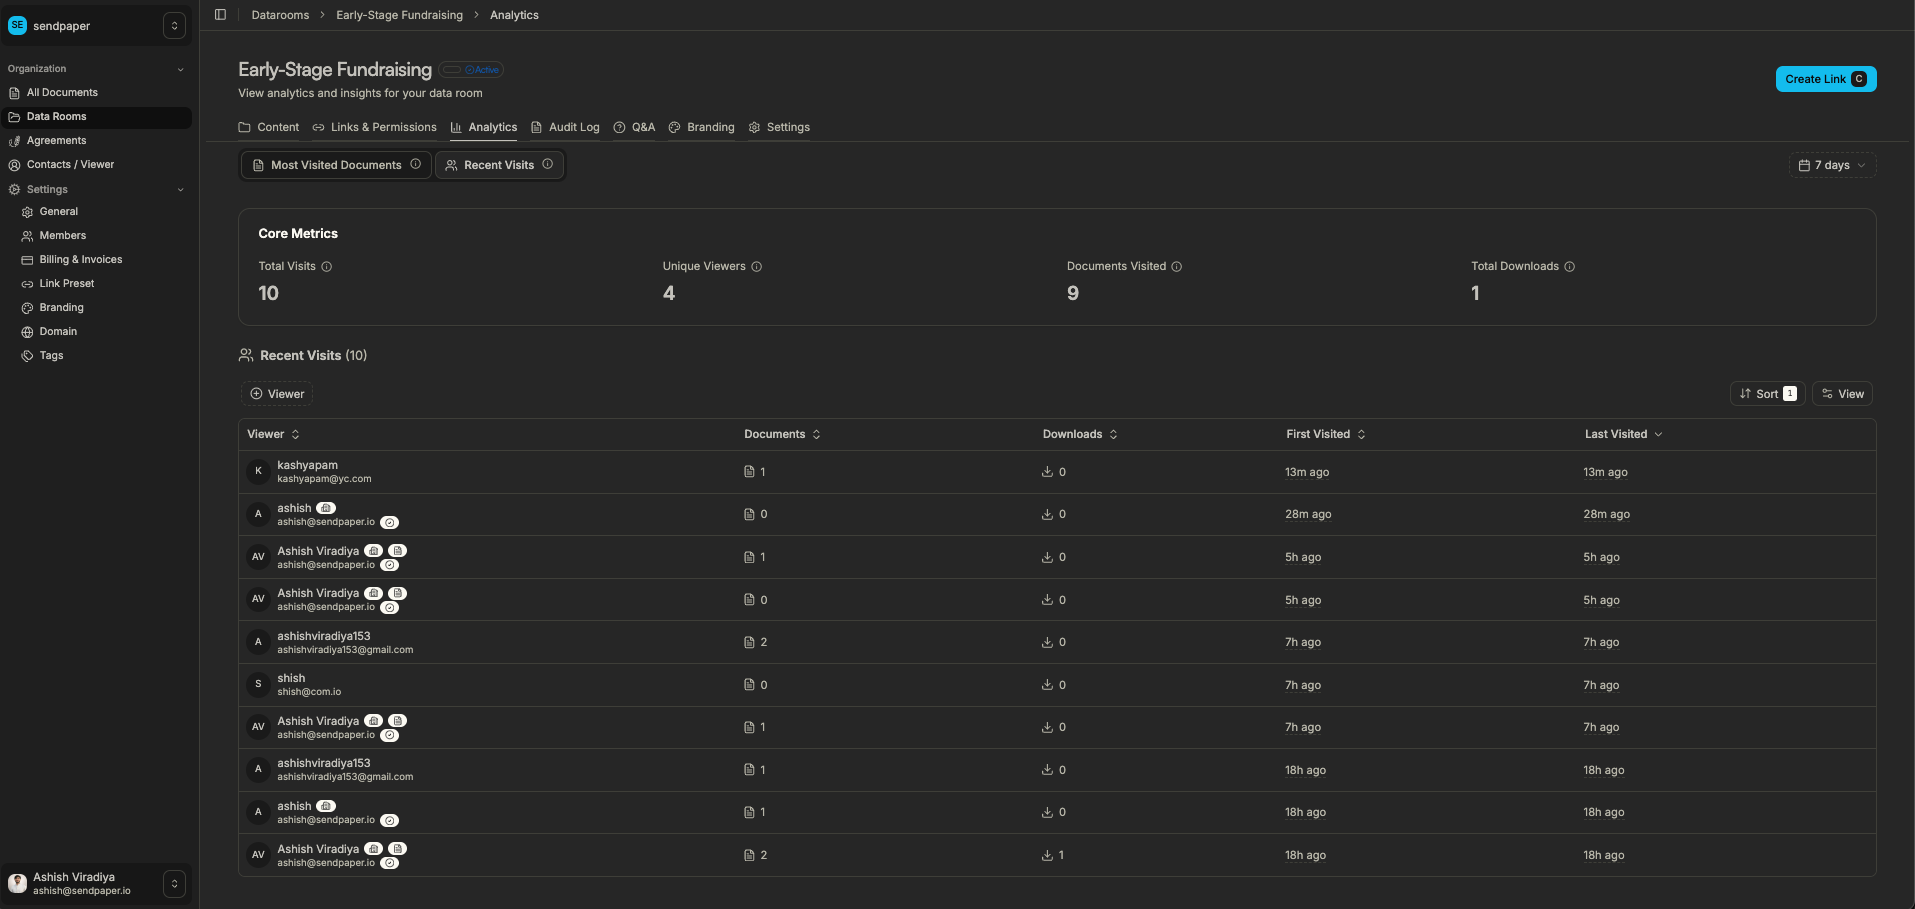
Recent Visits in a Sendpaper data room, showing who visited, how many documents they opened, downloads, and first/last visit time.
How Visit Sessions Are Computed
- A visit is one “trip” to the room by a viewer in the time range. Each row is one such visit.
- Documents - How many different documents this viewer opened during that visit.
- Downloads - How many times this viewer downloaded (single file, folder, or bulk) in the range. Each download action can include one or many documents.
- First Visited / Last Visited - The first and last time this viewer opened the room in the selected range.
If you use groups, the Recent Visits tab can be filtered to show only viewers in that group, so you see “recent visits for this audience” only.
Time Range and Filters
How This Fits With the Rest of Sendpaper
- Time range - At the top of the analytics tab you choose 7d, 14d, 30d, or a custom start/end date. Every metric and every row in both Most Visited Documents and Recent Visits respects this range. Changing the range refreshes the data.
- Document filter - In Most Visited Documents, you can filter by document name (search) to quickly find one file.
- Viewer filter - In Recent Visits, you can filter by viewer (name/email) to see only certain people.
- Group - When viewing analytics for a group, both tabs are scoped to that group’s viewers and their activity only.
- Audit log - The same activity (room opens, document opens, downloads) is recorded in the data room audit log. The audit log is the full history; analytics aggregate it into “most visited” and “recent visits” with date range and filters.
- Document-level analytics - For a single document (e.g. a pitch deck shared on its own), use document analytics. Data room analytics are for the room: all documents in the room and all visit sessions in one place.
- Permissions - Who can see the analytics tab follows your data room permissions. Only people who can access the room’s analytics see these two views.
How to get the most value from data room analytics
You get the best value when analytics tell you who is engaging and which materials actually get attention. Real teams use them to prep for calls, spot hot leads, and improve the room. These habits help you get there.
- Pick your key documents and watch them - In each room, decide what matters most (e.g. financial model, SPA, product deck) and check Most Visited Documents for those files. Use views, visitors, and average time to see if people are really reading. You get a clear signal before the next call or board meeting.
- One group per audience - Use groups so each bidder, investor, or advisor has their own link or group. Open analytics for that group and you see only that audience: what they opened, what they downloaded. No mixing. You get a clean read on who is hot and who is not.
- Check Recent Visits right after you send something - When you send an update, open exclusivity, or share new materials, look at Recent Visits in the next few days. You see who came back, what they opened, and whether downloads spiked. You get real feedback on whether the room is working.
- Use the numbers to improve the room - If important documents get few views, move them up in the folder, rename them, or call them out in your emails. Then check analytics again. You get a simple way to test what actually drives engagement.
- Use analytics for the big picture, the audit log for proof - Analytics show patterns: who is active, which files are hot. When you need to prove exactly what one person or group did, use the audit log for the full timeline. You get both insight and evidence in one workflow.
See the analytics in a data room demo
Sendpaper data room demo, including analytics for Most Visited Documents and Recent Visits alongside audit log, permissions, and Q&A.
Frequently Asked Questions
Related posts
- Product, GuidesData Room Groups: One Place for Permissions and Analytics | SendpaperUse data room groups in Sendpaper to manage permissions and analytics for investors, buyers, and teams. Create a group once, reuse it on links, and see group-level activity without spreadsheets.
- Product, GuidesHow Sendpaper renders files as images in the viewer (and why it matters) | SendpaperLearn how Sendpaper converts uploaded PDFs into page images for a fast, consistent viewer. We cover what formats can be shown, what processing means, and why a loader appears.
- Product, SecuritySecure PDF Document Sharing: Watermarking, Screenshot Protection, View-Only | SendpaperShare PDFs securely with watermarking, screenshot protection, view-only, and one-click agreement. Password and access control in Share Link and Access Control. One sidebar, all options.