Track listen time, completion rate, and engagement.

Audio analytics: see how your shared audio is played.

Listen time, completion rate, and drop-off. Know when links are opened and how much was played. For briefings, training, and data rooms.

No credit card required.

What you get with audio analytics.

01 feature folder

Geographic

See where listeners are located. Country and region in your dashboard.

02 feature folder

Device

Device type, OS, and browser. Know how your audio is being played.

03 feature folder

Real time

When links are opened and played. Live updates in the dashboard.

04 feature folder

Viewer insights

Who listened, when, and how long. Per-link and per-audio in the app.

05 feature folder

Listen time and completion

Listen time and completion rate per link. Which audio got finished.

06 feature folder

Drop-off

Where listeners stopped. Use drop-off points to improve your content.

How audio analytics works

Upload audio, create a per-audio or data room link, add protection and optional custom domain, then share. Recipients open the link in the secure viewer. Your dashboard shows when links were opened, listen time, and completion.

Create per-audio or data room link with protection and domain options

1. Upload audio, create a link, and add protection

  • Upload audio to a per-audio link or to a data room. Create the link you need (one file or a full room).
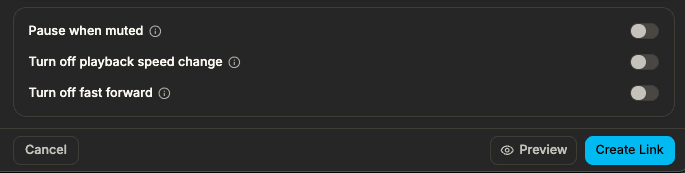
  • Add protection: password, link expiry, watermarking, screenshot protection, view-only, and more. Optionally set a custom domain so the link is personalized and on-brand.
  • Same flow whether you share a single audio file or a data room with audio.

Media Player Settings guide

2. Share the link; recipients open it in the secure viewer

  • Share your link. Recipients open it in the browser and listen in the secure viewer. No app or download required.
  • We track when the link was opened, listen time, completion rate, and where listeners dropped off.
  • Analytics work for every shared link, per-audio or data room.
Audio analytics dashboard with drop-off and engagement insights

3. See audio analytics in your dashboard

  • Your dashboard shows when each link was opened, listen time, completion rate, and drop-off points.
  • Use engagement data to time follow-ups and see which audio resonated.
  • Single links and data rooms both get full analytics; data rooms also get audit logs.

See data room in action

sendpaper.io

Ready to track audio listen time and engagement?

Benefits of audio analytics

Listen time, completion, drop-off

See when links were opened, how long each audio was played, and where listeners dropped off. Use engagement signals to time follow-ups and improve content.

No downloads, full tracking

Listeners play in the browser. You get accurate listen time and completion without asking them to download or install anything.

Works with data rooms

Audio in a data room gets the same analytics plus room-level audit logs. One place for audio and document visibility in due diligence and compliance.

Frequently Asked Questions

What audio analytics do I get?

You get total plays, when the link was opened, listen time, completion rate, and drop-off points. Per-audio and per-link breakdowns show how content was consumed so you can improve follow-ups and messaging.

Do listeners need to download the audio?

No. Listeners play in the browser. Analytics are based on in-viewer playback, so you get accurate listen time and completion without requiring downloads.

Can I use audio analytics in a data room?

Yes. Audio in a data room is tracked the same way. You get per-audio analytics plus room-level audit logs and reporting for compliance and follow-up.

How do I track audio engagement?

Upload audio, create a per-audio or data room link, add protection (password, link expiry, etc.) and optional custom domain, then share the link. We track plays, listen time, and completion automatically. Your dashboard shows when links were opened and how much was played.

Get early access

Track audio listen time, completion, and engagement.